John was experiencing chronic pain. Although his discomfort began in childhood, as an adult, he began to experience a steady decline. He had gut problems that caused him pain and burning after eating, and what was even more frightening was that he began to see large amounts of blood in the toilet. With the pain almost always present, John described the sensation as feeling like, “barbed wire was making its way through my intestines”.
Unfortunately, after seeing several doctors, he still didn’t have answers as to why he was experiencing this intense pain. John was also growing frustrated. After repeated tests, nobody was able to provide him with a diagnosis and each new medical provider lent on the same method of treatment, recommending dietary changes. He knew — from having been prescribed this protocol many times — that changing his diet wasn’t likely to help, and that he was becoming increasingly desperate for a solution.
Katie McCurdy Steps In
Although John kept his medical condition hidden for a long time, he finally disclosed to his friend, Katie McCurdy the extent of his suffering. She could easily relate. As a longtime autoimmune patient with Myasthenia Gravis, a disease associated with muscle weakness, Katie started experiencing a host of inexplicable symptoms in her 30s. It took a battery of tests, years of time, and many doctors from different specialties before she finally got a second diagnosis of Sjogren’s Syndrome, an autoimmune disorder that typically causes dry eyes and dry mouth.
You may recall us writing about Katie’s case in an How Patient Stories Impact Patient Engagement: A Conversation with Jan Oldenburg.
While these diagnoses were hard to come by, Katie found that what helped was creating a visual representation of her symptoms. As a designer, she charted her symptoms on a timeline (pictured below) and her medical team used them, in part, to reach a diagnosis. Because Katie was able to see firsthand how helpful visual representations could be in the medical field, she became an invaluable resource for John.
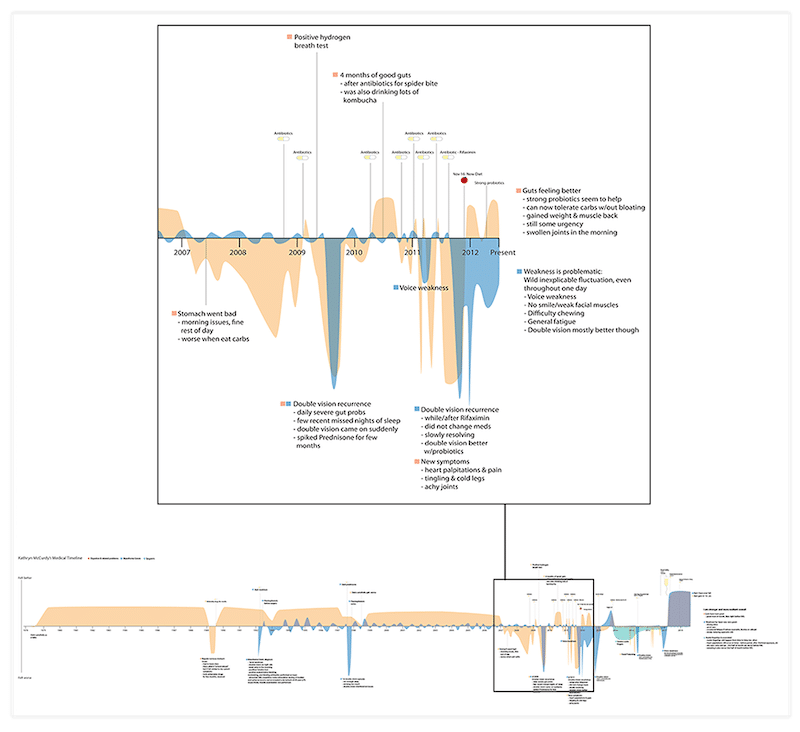
Pictured: Katie’s visual representation of how she felt from 1979 to present day. The box shows a close up of 2007 to 2012.
A Visual Representation is Created
In an article Katie wrote for Medium called Blood and Barbed Wire, she writes, “Since this is ‘what I do’, I offered to work with [John] to put together a visual representation of his health before his next doctor appointment”.
John agreed to let Katie help him and they set up a meeting. He arrived prepared with four single-spaced pages, detailing descriptions of his symptoms, the tests he’d done, the diets and other treatments he’d tried, his family history, and more.
It was immediately apparent to Katie that it was an immense amount of information for a doctor to take in during just one appointment. After years struggling to find a diagnosis for her own troubling symptoms, she was well-aware of the difficulties medical professionals have in trying to rapidly gather years of medical records from multiple specialists.
Still, Katie knew how beneficial visual representations could be. As she puts it, “What I found was that most doctors really appreciated the visual map I had created in the past. It gave them access to information that they would otherwise have to really dig around in my record to find.”
Katie wanted to do the same thing for John. To begin, she taped together four pieces of paper to make a timeline similar to that above. John then added significant events to the timeline. From the best of his memory, he jotted down the dates he’d seen particular specialists and the methods of treatments he’d tried after each consultation.
Next, Katie drew the silhouette of a body and asked John to add icons to the figure to better illustrate the symptoms he was experiencing. Katie had prepared the icons in advance, believing that one of the best ways for John to tell his story was to provide his doctors with pictures of how his body felt on a good day and on a bad day.
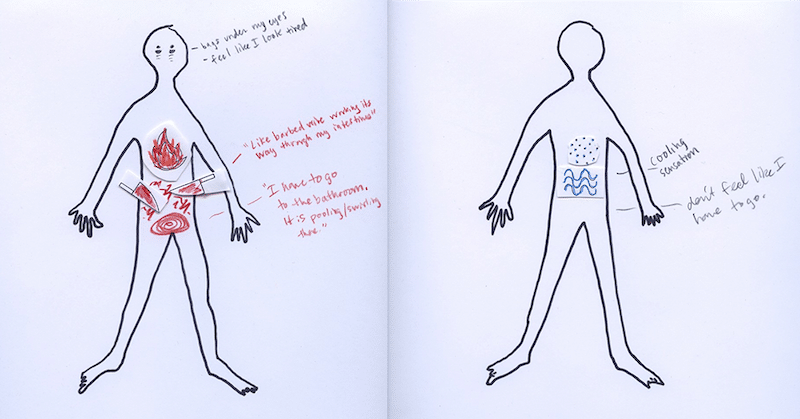
Pictured: John’s original drawings of a bad day (left) and a good day (right)
Katie then used these drawings and the sketched timeline to synthesise his medical history. She began by creating a digital timeline of John’s symptoms, using Adobe Illustrator. She also created a well-formatted, scannable Google document that easily highlighted all of the main things that John wanted doctors to know about his condition.
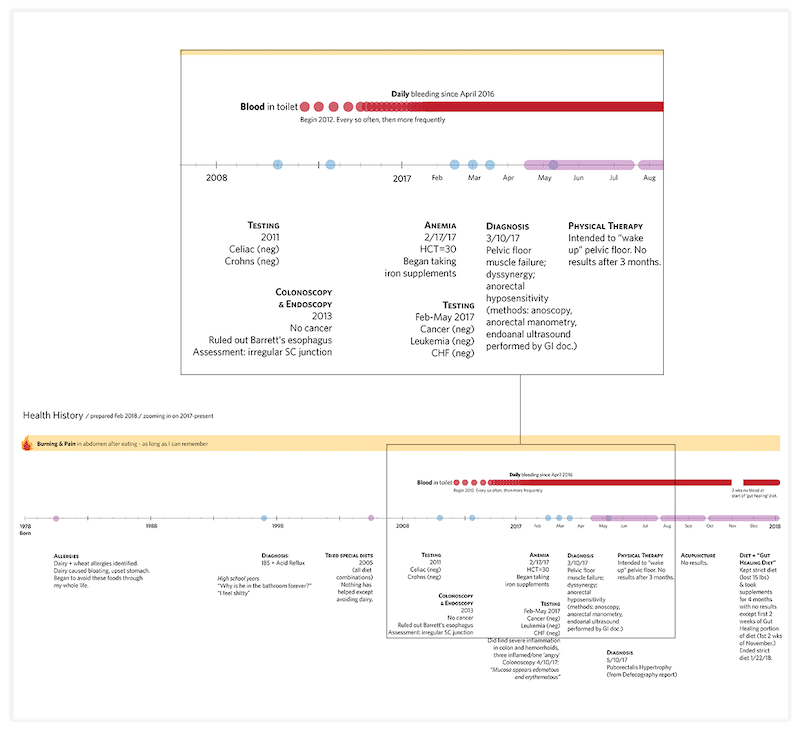
Pictured: John’s visual representation of how he felt from 1978 to present day.
Because John was feeling particularly frustrated about being asked to make the same dietary changes over and over, Katie made sure to include a long list of treatments John had tried and whether they had helped or not. With this information in hand, John was feeling much more empowered and optimistic about his upcoming doctor appointment.
John’s Appointment
When I interviewed Katie, she said, “When [John] went into his doctor appointment, he sort of did what I did. He laid his papers down and then he talked through everything and pointed things out as he was talking. And, for the first time, he felt confident presenting his story.”
John wasn’t the only person who benefited from the work Katie and him had done. His doctor liked the visual representation too. John texted Katie after the consultation, writing, “The design was SUPER helpful and the doc was also very impressed/appreciative.”
Katie felt even more gratified when John mentioned that on subsequent doctor’s visits that medical professionals walked into the room holding the visuals she’d created. She explains, “I think a big benefit is it’s externalising all the information that doctors would usually have to keep in their heads… and no one can keep all that information in their heads. It’s a prop — something to refer to.”
The Benefits of Visual Representations in Healthcare
Katie believes there the primary way that these types of representations can improve medical care is actually by reducing an overflow of information all at once that often leads to analysis paralysis.
“What I’m hearing from patients when I talk to them is that a lot of people just sort of give up over time because of these complexities. They’re just like ‘Well, I don’t’ feel anyone can help me because they haven’t helped me so far and no one believes me.”
She went on to explain, “What can be so challenging is for people who have so many symptoms… they might be dealing with different specialists, different symptoms, different body systems. It’s very overwhelming because when someone like John or myself goes to see their doctor, they want to talk about everything they are experiencing, but it can be really challenging for doctors to process all that information.
Katie’s Plans
Because Katie wants to continue helping people like John with visual representations, she’s beginning a startup called Pictal Health. She says, “The goal [of Pictal] is to transform health histories into visual stories.
“So, basically it’s taking a person’s history, figuring out how to make it visual so that doctors and patients can really communicate and collaborate better and leading to, hopefully, a higher rate of diagnosis, and helping patients get the right treatment. The ultimate goal for me is to help patients get back to their lives.”
As of right now, Katie is still trying to determine the best way to help each individual patient. She says, “For each person, what they need to communicate, or how they need to tell their stories is a little different from one person to the other. I’m trying to learn from that so I can figure out what patterns patients tools are most effective, whether that’s worksheets that they can fill out, or a timeline, or drawings on the body, or something else that we haven’t thought of yet.”
How Doctors Can Use Katie’s Tools
Katie has prepared a Health Summary Google document that patients can fill in. It will be a questionnaire that patients can fill in. You can download it for free here.
She also has a template available online that doctors can provide their patients. The template includes a health timeline, two dimensional figures of the body, and icons representing symptoms. The template is a free download available here.
Doctors may also want to stay updated on Katie’s work. She’s written a number of articles for Medium about the visual representations she makes for the health field. You can read them or start following Katie’s posts here.
John Finds Help
Since John provided doctors with his visual resources they’ve determined that he had two major Upper GI and Lower GI issues. Katie says, “He had an endoscopy and colonoscopy and they figured out that his severe upper GI issue was actually acid reflux that just went undiagnosed for a long time. They also have a tentative diagnosis for the Lower GI stuff, they just don’t yet know what the treatment plan is, but they should know soon”.
Perhaps even more importantly than that, John finally feels optimistic about the future. Katie shares, “I think it helped him feel like he had actually made progress for the first time in a long time, and he felt more confident that those treating him weren’t going to force him to do stuff that he’d already done”.
John and Katie’s stories are great examples of how patient engagement can improve medical care. Perhaps without their intense focus on finding improvement — and a diagnosis — they’d still be suffering the same barrage of inexplicable symptoms.