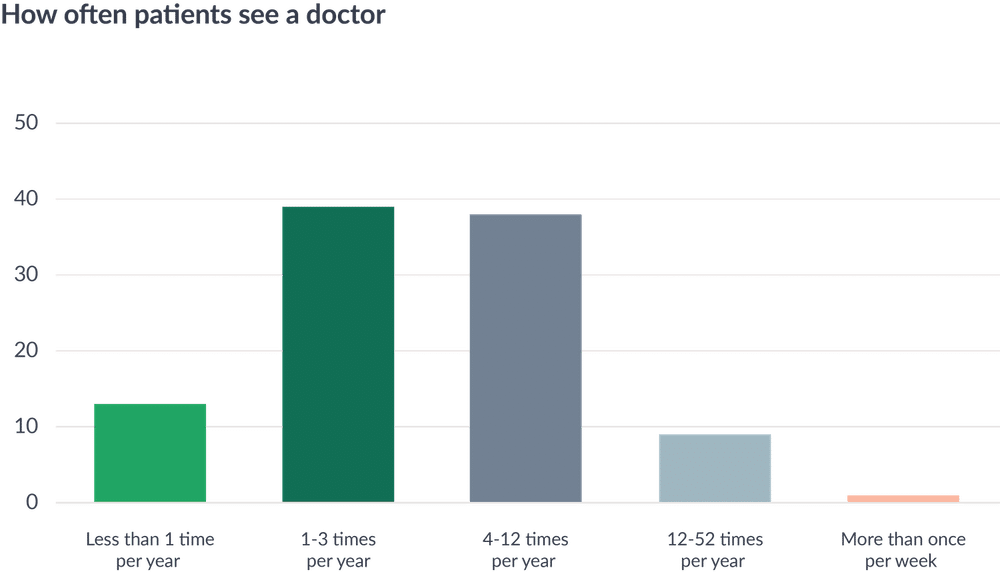
Looking at the results from HotDoc’s Patient Survey 2020 (a survey of 618 Australians) we found 48% of Australians visit a doctor more than 3 times a year. 38% say they visit their doctor between 4 and 12 times a year, 9% between 12 and 52 times a year and 1% more than once a week. The remaining patients visit their doctor 3 times or less per year – 39% visit a doctor 1 to 3 times a year and 13% visit a doctor less than once a year.
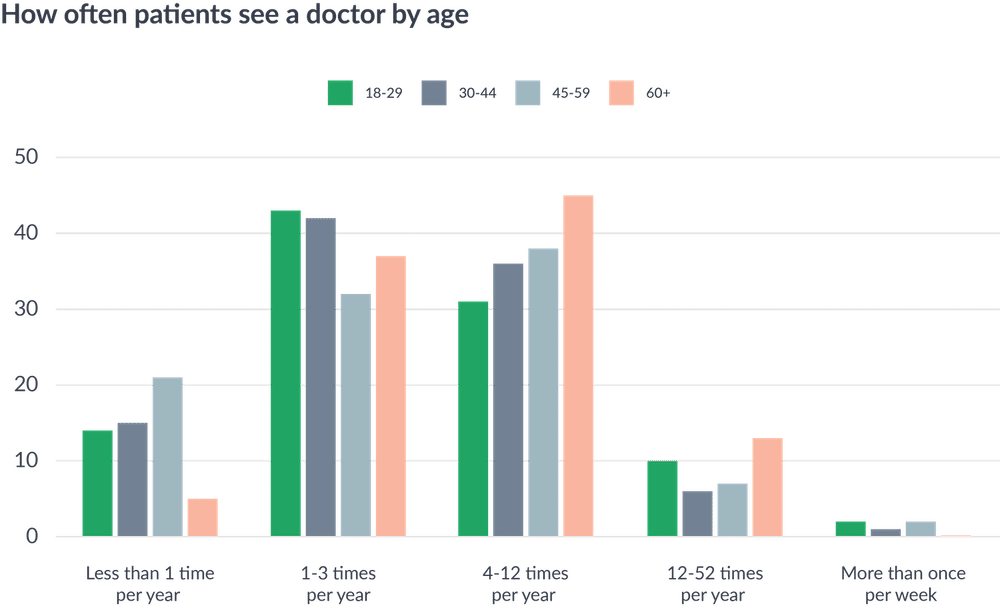
45-59 year olds are 4 times more likely than 60+ year olds to visit a doctor less than once a year
Considering our health typically declines with age, it makes sense that seniors visit their doctor most often. 37% of 60+ year olds see a doctor 1 to 3 times a year, 45% see a doctor 4 to 12 times a year, 13% between 12 and 52 times a year, and just 5% less than once a year. No seniors surveyed visited their doctor more than once a week.
In 45-59 year olds, 32% visit a doctor 1 to 3 times a year, 38% between 4 and 12 times a year, 7% between 12 and 52 times a year, and 21% less than once a year. 2% of 45-59 year olds see their doctor more than once a week.
In 30-44 year olds the frequency of visits declined again. 42% of 30-44 year olds go to the doctor 1 to 3 times a year, 36% make 4 to 12 visits a year, 6% make 12 to 52 visits a year, and 15% visit less than once a year. Just 1% make a visit more than once a week.
In 18-29 year olds, 43% visit a doctor between 1 and 3 times a year, 31% visit between 4 and 12 times a year, 10% go 12 to 52 times a year, and just 14% go less than once a year. 2% visit their doctor more than once a week.
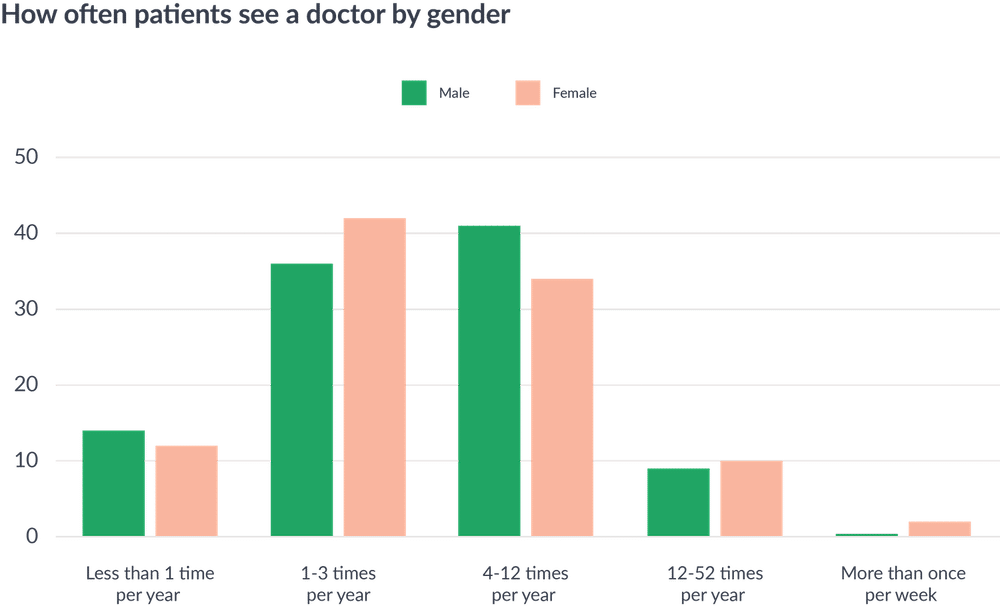
50% of men visit a doctor more than 3 times a year compared to 46% of women
In females, 42% of patients visit a doctor 1 to 3 times a year. This dropped to 34% in those visiting a doctor 4 to 12 times a year, 10% visiting their doctor 12 to 52 times a year, and 12% visiting a doctor less than once a year. 2% of women head to the doctor more than once a week.
Comparatively, in males, 36% visit a doctor 1 to 3 times a year, 41% between 4 and 12 times in a year, 9% between 12 and 52 times a year, and 14% less than once a year. No males recorded visiting the doctor more than once a week.
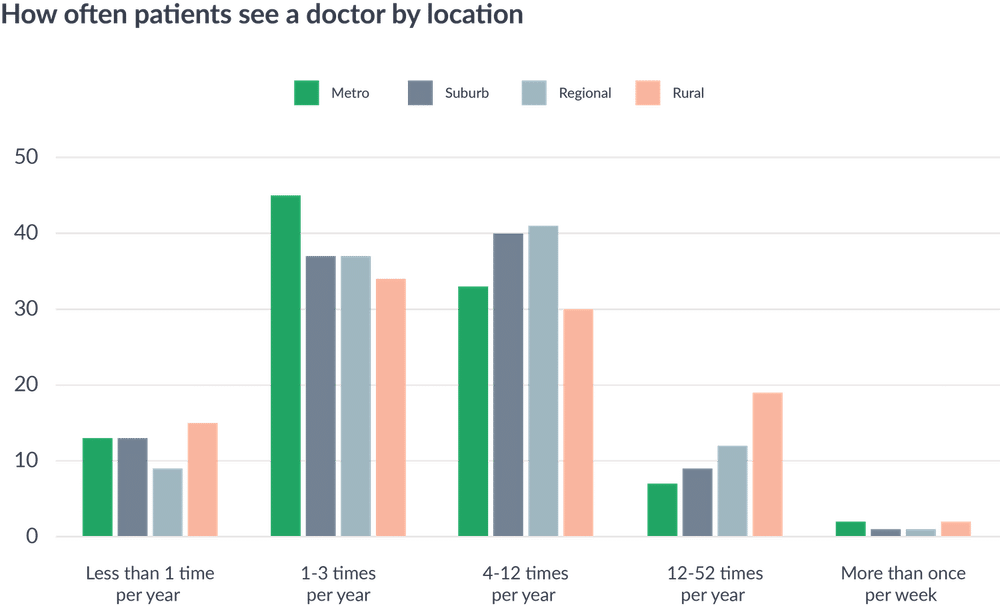
Metropolitan patients visit doctors least often
Like age, location is a big factor when it comes to the frequency of doctor visits.
In metropolitan areas, 45% of patients see a doctor 1 to 3 times a year, 33% see a doctor 4 to 12 times a year, 7% between 12 and 52 times a year, and 13% less than once a year. Just 2% visit their doctor more than once a week.
In suburban areas, 37% of patients see a doctor 1 to 3 times a year, 40% see a doctor 4 to 12 times a year, 9% between 12 and 52 times a year, and 13% less than once a year. 1% visit their doctor more than once a week.
In regional areas, 37% of patients see a doctor 1 to 3 times a year, 41% see a doctor 4 to 12 times a year, 12% between 12 and 52 times a year, and 9% less than once a year. Just 1% visit their doctor more than once a week.
In rural areas, 34% of patients see a doctor 1 to 3 times a year, 30% between 4 and 12 times a year, 19% between 12 and 52 times a year, and 15% less than once a year. 2% visit their doctor more than once a week.
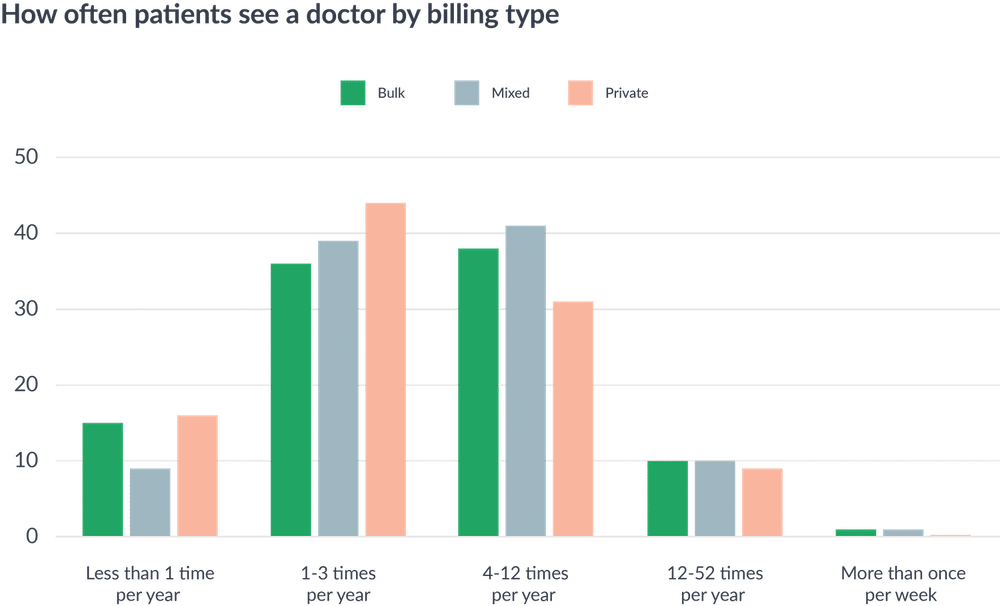
Private billed patients go to the doctor less often than mixed or bulk billed patients
In private billed patients, 44% visit a doctor 1 to 3 times a year, 31% between 4 and 12 times a year, 9% between 12 and 52 times a year, and 16% less than once a year. No private billed patients surveyed visited a doctor more than once a week.
In bulk billed patients, 36% visit a doctor 1 to 3 times a year, 38% between 4 and 12 times a year, 10% between 12 and 52 times a year, and 15% less than once a year. 1% visit a doctor more than once a week.
In mixed billed patients, 39% visit a doctor 1 to 3 times a year, 41% between 4 and 12 times a year, 10% between 12 and 52 times a year, and 9% less than once a year. 1% visit a doctor more than once a week.
Patients with a chronic condition are twice as likely to visit a doctor more than 3 times a year than those without a chronic condition
Unsurprisingly, patients with a chronic condition tend to visit the doctors much more frequently than those without. 29% visit a doctor 1 to 3 times a year, 48% between 4 and 12 times a year, 16% between 12 and 52 times a year, and 5% less than once a year. 2% of patients with a chronic condition visit a doctor more than once a week.
In patients without a chronic condition, 51% visit a doctor 1 to 3 times a year, 24% between 4 and 12 times a year, 2% between 12 and 52 times a year, and 23% less than once a year. No patients without a chronic condition visited a doctor more than once a week.
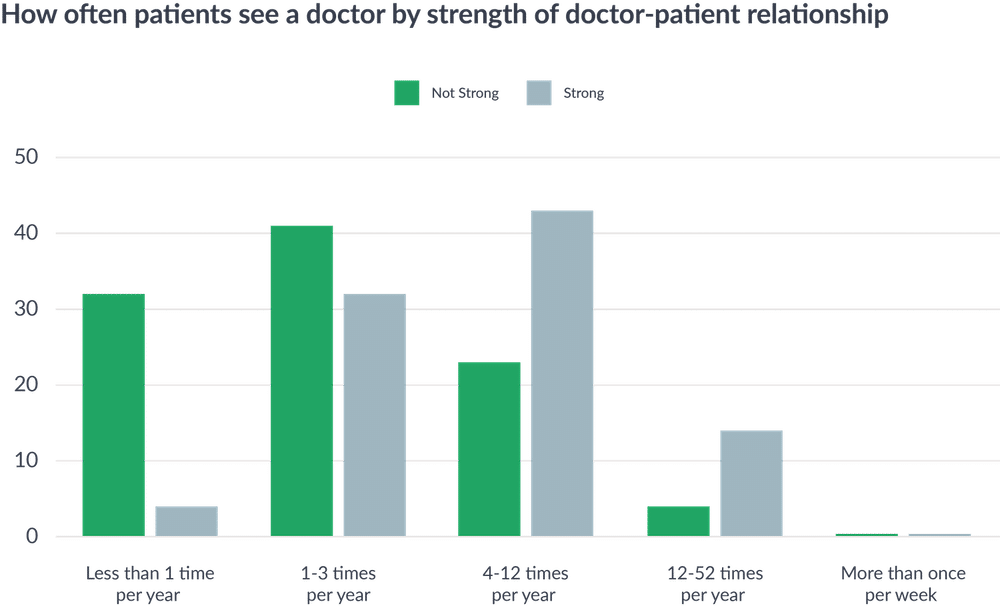
Patients who have a weak relationship with their GP are 8 times more likely to visit a doctor less than once a year than those who have a strong relationship with their GP
It is clear that a strong doctor-patient relationship encourages patients to visit their doctor more often. In those patients who say they have a strong relationship with their doctor, 39% visit a doctor 1 to 3 times a year, 43% between 4 and 12 times a year, 14% between 12 and 52 times a year, and just 4% less than once a year. 0% visited their doctor more than once a week.
In those patients who say they have a poor relationship with their doctor, 41% visit a doctor 1 to 3 times a year, 23% between 4 and 12 times a year, 4% between 12 and 52 times a year, and a whopping 32% say they visit a doctor less than once a year. 0% visited their doctor more than once a week.